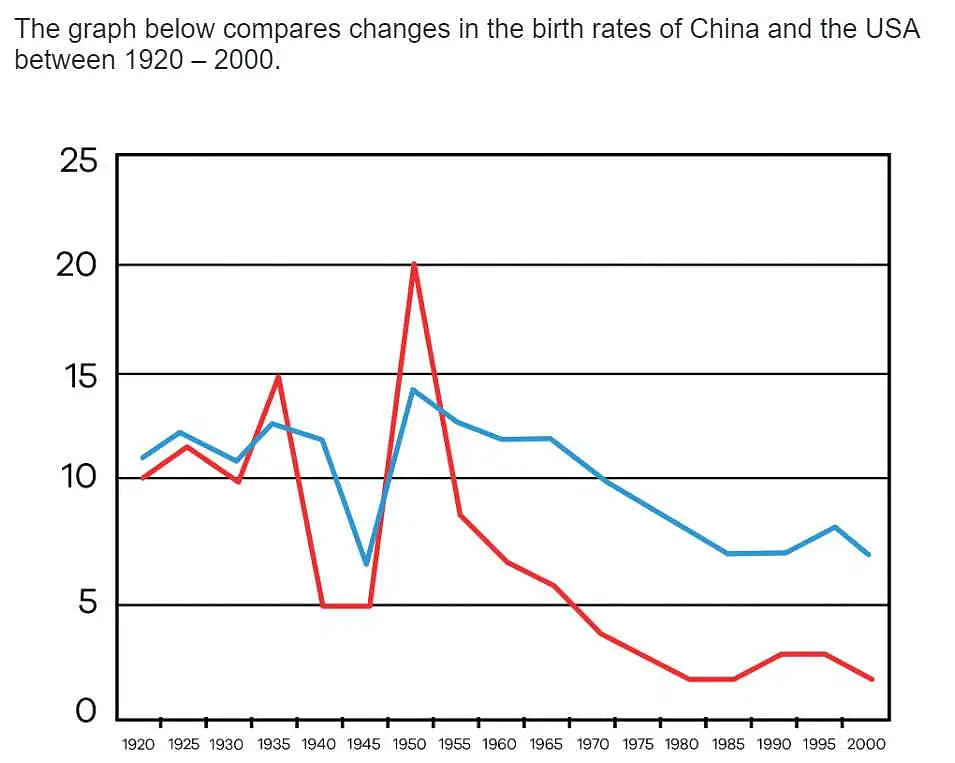
Line Graph Task 1
Check: Get 10 Free IELTS Sample Papers
Check: Register for IELTS Coaching - Join for Free Trial Class Now
Overview of Line Graph Task 1

The candidate should answer a typical question based on a line graph in 20 mins with an exemplary answer of over 150 words.
Following are the IELTS writing tips that candidates can use while preparation for writing task 1 line graph:-
- Paraphrasing the question or topic of line graph IELTS task 1 in the introductory/ first paragraph
- Explaining the main feature in the graphs for IELTS while explaining the overall trend
- Each paragraph should have an appropriate example with numbers and percentages to support the statement made in the paragraph regarding the data.
- Using the correct grammar form. Using the suitable verbs, nouns, adverbs, adjectives, prepositions in the right places to emphasize the point.
- Look into various articles with graphs to understand how a good article is written and to know the words used in different variants of articles
- Practice writing answers to different line graph-based questions to have a clear understanding and be able to complete the answer in under 20 mins.
Parameters and Vocabulary for Line GraphTask 1
The following table explains the parameters of measuring and evaluating Line Chart Task 1. Candidates need to identify the following parameters and use the vocabulary to expalin the Line Graph IELTS. examples have been provided in support of the parameters and vocabulary for time for better understanding of the graphs for IELTS.
| Parameters | Vocabulary for time | Examples |
|---|---|---|
| Prepositions of time | at on in by around |
at 5:00 pm On 4th August In summer by the morning around 5:00 pm |
| Adverbs and adjectives that describe a change | Increases Decreases |
It increased drastically The pain decreased gradually |
| Verbs for Trends | Rise Go up Grow Decline drop fall |
the prices for onions go up during the monsoons. the company grew rapidly there has been no decline in the growth since march. there has been a rise in online shopping The interest for fidget spinners dropped by 65% it was unlikely for the stock rate to fall. |
Line graph Task 1 question does not require a conclusion but needs to clearly explain the given graph including all the relevant information. The above information on graphs for IELTS can be considered helpful for the candidates to evaluate and explain Line graph IELTS writing task 1.
Check- IELTS Writing Samples
- Line Graph Showing Paris Metro Station Passengers IELTS Academic Writing Task 1
- Nutritional Consistency Of Two Dinners IELTS Writing Task 1
- Participation of Boys and Girls in different Sports IELTS Writing task 1
- Line Graph Showing Percentage of Car Ownership in Great Britain IELTS Writing Task 1
- Cross-sections of Two Tunnels IELTS Writing Task 1
- Changes in Spending Habits of People in UK IELTS Writing Task 1
- Life Cycle of the Salmon IELTS Writing Task 1
- Visitor statistics for 1996,1998 and 2000 Table IELTS Writing Task 1
- The Percentage Of Water Used By Different Sectors Pie Chart IELTS Writing Task 1
- The Diagrams below Show the life cycle of the Silkworm and the Stages in the Production of Silk Cloth IELTS Writing Task 1
- Two Pie Charts showing the Percentages of Energy IELTS Writing Task 1
- A Charts Below Show the Banana export in 1993 and 2003 IELTS Writing Task 1
- Number of visitors to three London Museums between 2007 and 2012 IELTS Writing task 1
- Comparison with Different Degrees Working in Engineering Company in 1980 and 2008 IELTS Writing Task 1
- Maximum Number of Asia Elephants between 1994 and 2007 IELTS Writing Task 1
- Average Maximum Temperatures for Auckland and Christchurch IELTS Writing Task 1
- Percentage of People Living Alone in 5 Different Age Groups in the US IELTS Writing Task 1
- Average Daily Minimum and Maximum of two Air Pollutants IELTS Writing Task 1
- Journeys made by Different Forms of Transport in Four Countries IELTS Writing Task 1
- Rates of Unemployment IELTS Writing Task 1
Comments