Charts Illustrating How Recycling is Carried Out in Eutopia IELTS Writing Task 1
Charts Illustrating How Recycling is Carried Out in Eutopia IELTS Writing Task 1 is an IELTS academic topic. This IELTS writing task 1 has a bar graph showing the recycling process in Eutopia and pie charts detailing the percentage of recycled and unrecycled waste. IELTS Writing Task 1 requires candidates to write a summary or overview based on a diagram, a table, a line graph, or a bar graph. The IELTS academic writing task 1 is a writing task of 150 words. IELTS writing score is marked based on band scores. Candidates are given 20 minutes and are required to write a summary for IELTS Academic Writing Task 1. Meanwhile, candidates might consider practicing IELTS writing practice papers to excel in writing skills. The band scores range from 0 to 9.
Check: Get 10 Free IELTS Sample Papers
Check: Register for IELTS Coaching - Join for Free Trial Class Now
Topic: The charts illustrate how recycling is carried out in Eutopia, and the pie charts show the percentage of recycled and unrecycled waste.
Band 8 IELTS Answer
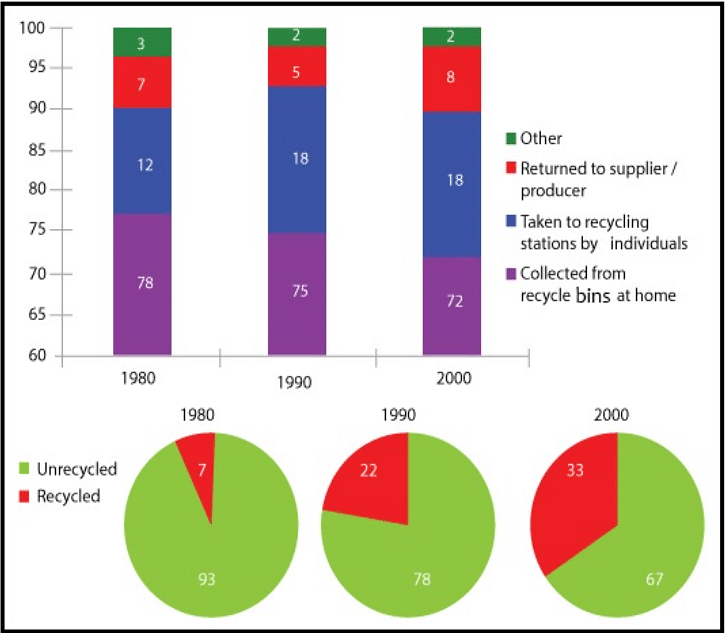
Bar graphs showing different recyclable waste management techniques. Pie charts comparing recycled and non-recycled destruction levels for the years 1980, 1990, and 2000 in Eutopia.
Overall, there has been little change in waste reprocessing methods, but in 2000, waste recycling methods increased significantly.
In 1980, only 7% of waste was recycled and the rest remained untreated. 12% of recyclables were sent to the house for processing by residents. There was little difference between the other methods and the waste return rate to the manufacturer, which were 3% and 7% respectively.
After a decade, the waste recycling rate tripled compared to 1980. People brought trash to station and the rate increased by nearly 50% (18%). A small change was observed for the other reprocessing methods.
In ten years, almost one-third of all waste has been recycled in Eutopia. Waste collected in bins was almost stable (72%). Whereas waste returned to suppliers grew and stood at 8%.
Band 7.5 IELTS Answer
The bar chart illustrates the waste reuse conveyance process and the pie chart shows the total recovery rate of recyclable waste in Utopia over 20 years.
In general, the chart shows that the maximum amount of waste is achieved in two ways, collecting waste from home and disposing of waste at recycling stations. The amount of non-recyclable waste reaches the highest in the first year.
Specifically, high-end waste was collected by household trash at a rate of 78% in 1980. This number decreased from 3 to 10 years and continuously decreased to 72% in 2000. Then, 12% of the waste carried away by people went to wastewater treatment plants in 1980. However, this proportion increased and transported a total of 18% of waste in 1990. This amount increased from 73% to 90% in 2000. Moreover, only 7% of the ratio of garbage recycled with the method of return to supplier or manufacturer. This number was downgraded to 5% in 1990. Fortunately, this amounting covered 8% of the garbage that got recycled this way. Therefore, only 3% of waste got reclaimed with another method in 1980 and after 20 years this amount reduced to 2% in 2000.
Furthermore, the highest number of garbage was recycled at 93 people in 1980. However, this trend turned negative, and the value plunged to 78% in 1990 and declined by 11% in the final year. In terms of recycled garbage starting from 7% in the first year, it is interesting to note that 22% of waste was reclaimed in 1990 this number reached 33% in 2000.
Band 7 IELTS Answer
The bar chart depicts different processes of recycling in Eutopia and the pie charts indicate the percentage of recycled waste in 1980, 1990 and 2000. Based on the chart, it is evident that the proportion of recyclables collected from recycle bins at home remains the highest throughout the 20 years span. However, the percentage decreased from 78% in 1980 to 72% in 2000.
On the other hand, recyclables taken to recycling stations increased from 12% in 1980 to 18% in 2000. By contrast, recyclables returned to suppliers or producers as well as other processes remain constant throughout the year.
In 1980, the percentage of recycled waste was only 7%. This has shown a sharp increase over the decade. In 1990, the proportion of recycled waste became threefold to 22%. Again 2000, it increased by 33% and became one-third of the total amount of waste.
Check IELTS Writing Samples
- Plans For Redevelopment Of Islip Town IELTS Writing Task 1
- Graph showing how elderly people in the United States spent their free time between 1980 and 2010 IELTS Writing Task 1
- Pie Chart Showing Reasons for Agricultural Land Becoming Less Productive IELTS Writing Task 1
- Average monthly temperatures and the average number of hours of sunshine per year IELTS Writing Task 1
- Bar graph showing the total manufacturing production in percentages IELTS Writing Task 1
- Popularity Of Various Leisure Activities Among European Adults IELTS Writing Task 1
- The Graphs Below Show The Number Of Hours Canadians Spend On Watching TV from 1990-2000 IELTS Writing Task 1
- Two Pie Charts showing the Percentages of Energy IELTS Writing Task 1
- A Charts Below Show the Banana export in 1993 and 2003 IELTS Writing Task 1
- Number of visitors to three London Museums between 2007 and 2012 IELTS Writing task 1
- Comparison with Different Degrees Working in Engineering Company in 1980 and 2008 IELTS Writing Task 1
- Maximum Number of Asia Elephants between 1994 and 2007 IELTS Writing Task 1
- Average Maximum Temperatures for Auckland and Christchurch IELTS Writing Task 1
- Percentage of People Living Alone in 5 Different Age Groups in the US IELTS Writing Task 1
- Average Daily Minimum and Maximum of two Air Pollutants IELTS Writing Task 1
- Journeys made by Different Forms of Transport in Four Countries IELTS Writing Task 1
- Rates of Unemployment IELTS Writing Task 1
- The bar chart gives us the information about the life expectancy in Japan, United States, Korea and Indonesia IELTS Writing Task 1
- Percentage of employers in various sectors having difficulty in finding staff in 2003 and 2004 IELTS Writing Task 1
- Percentage Of UK Households With Selected Consumer Durables Between 1996 and 2006 IELTS Writing Task 1
- Information About Medical Care In Three European Countries Between 1980 and 2000 IELTS Writing Task 1
- The Percentage Of Men And Women Aged 60-64 Who Were Employed In Four Countries in 1970 and 2000 IELTS Writing Task 1
- Total Number Of Cruise Passengers, And Their Percentage According To Age In 1975 and 2003 in the UK IELTS Writing Task 1
- Time Spent on Telephone Calls IELTS Writing Task 1
- Consumption of food in 2008 in China and India IELTS writing task 1
Comments